IBM | IBM Watson Health UI/UX
IBM Watson Health compliance assessment project is an assessment and self-driven tool for customers or facilitates to further transact with the compliance consultants. I was asked to be the UI/UX partner for the project with the Somnio team to help design, create, and prototype. Role: UI/UX.

The Challenge
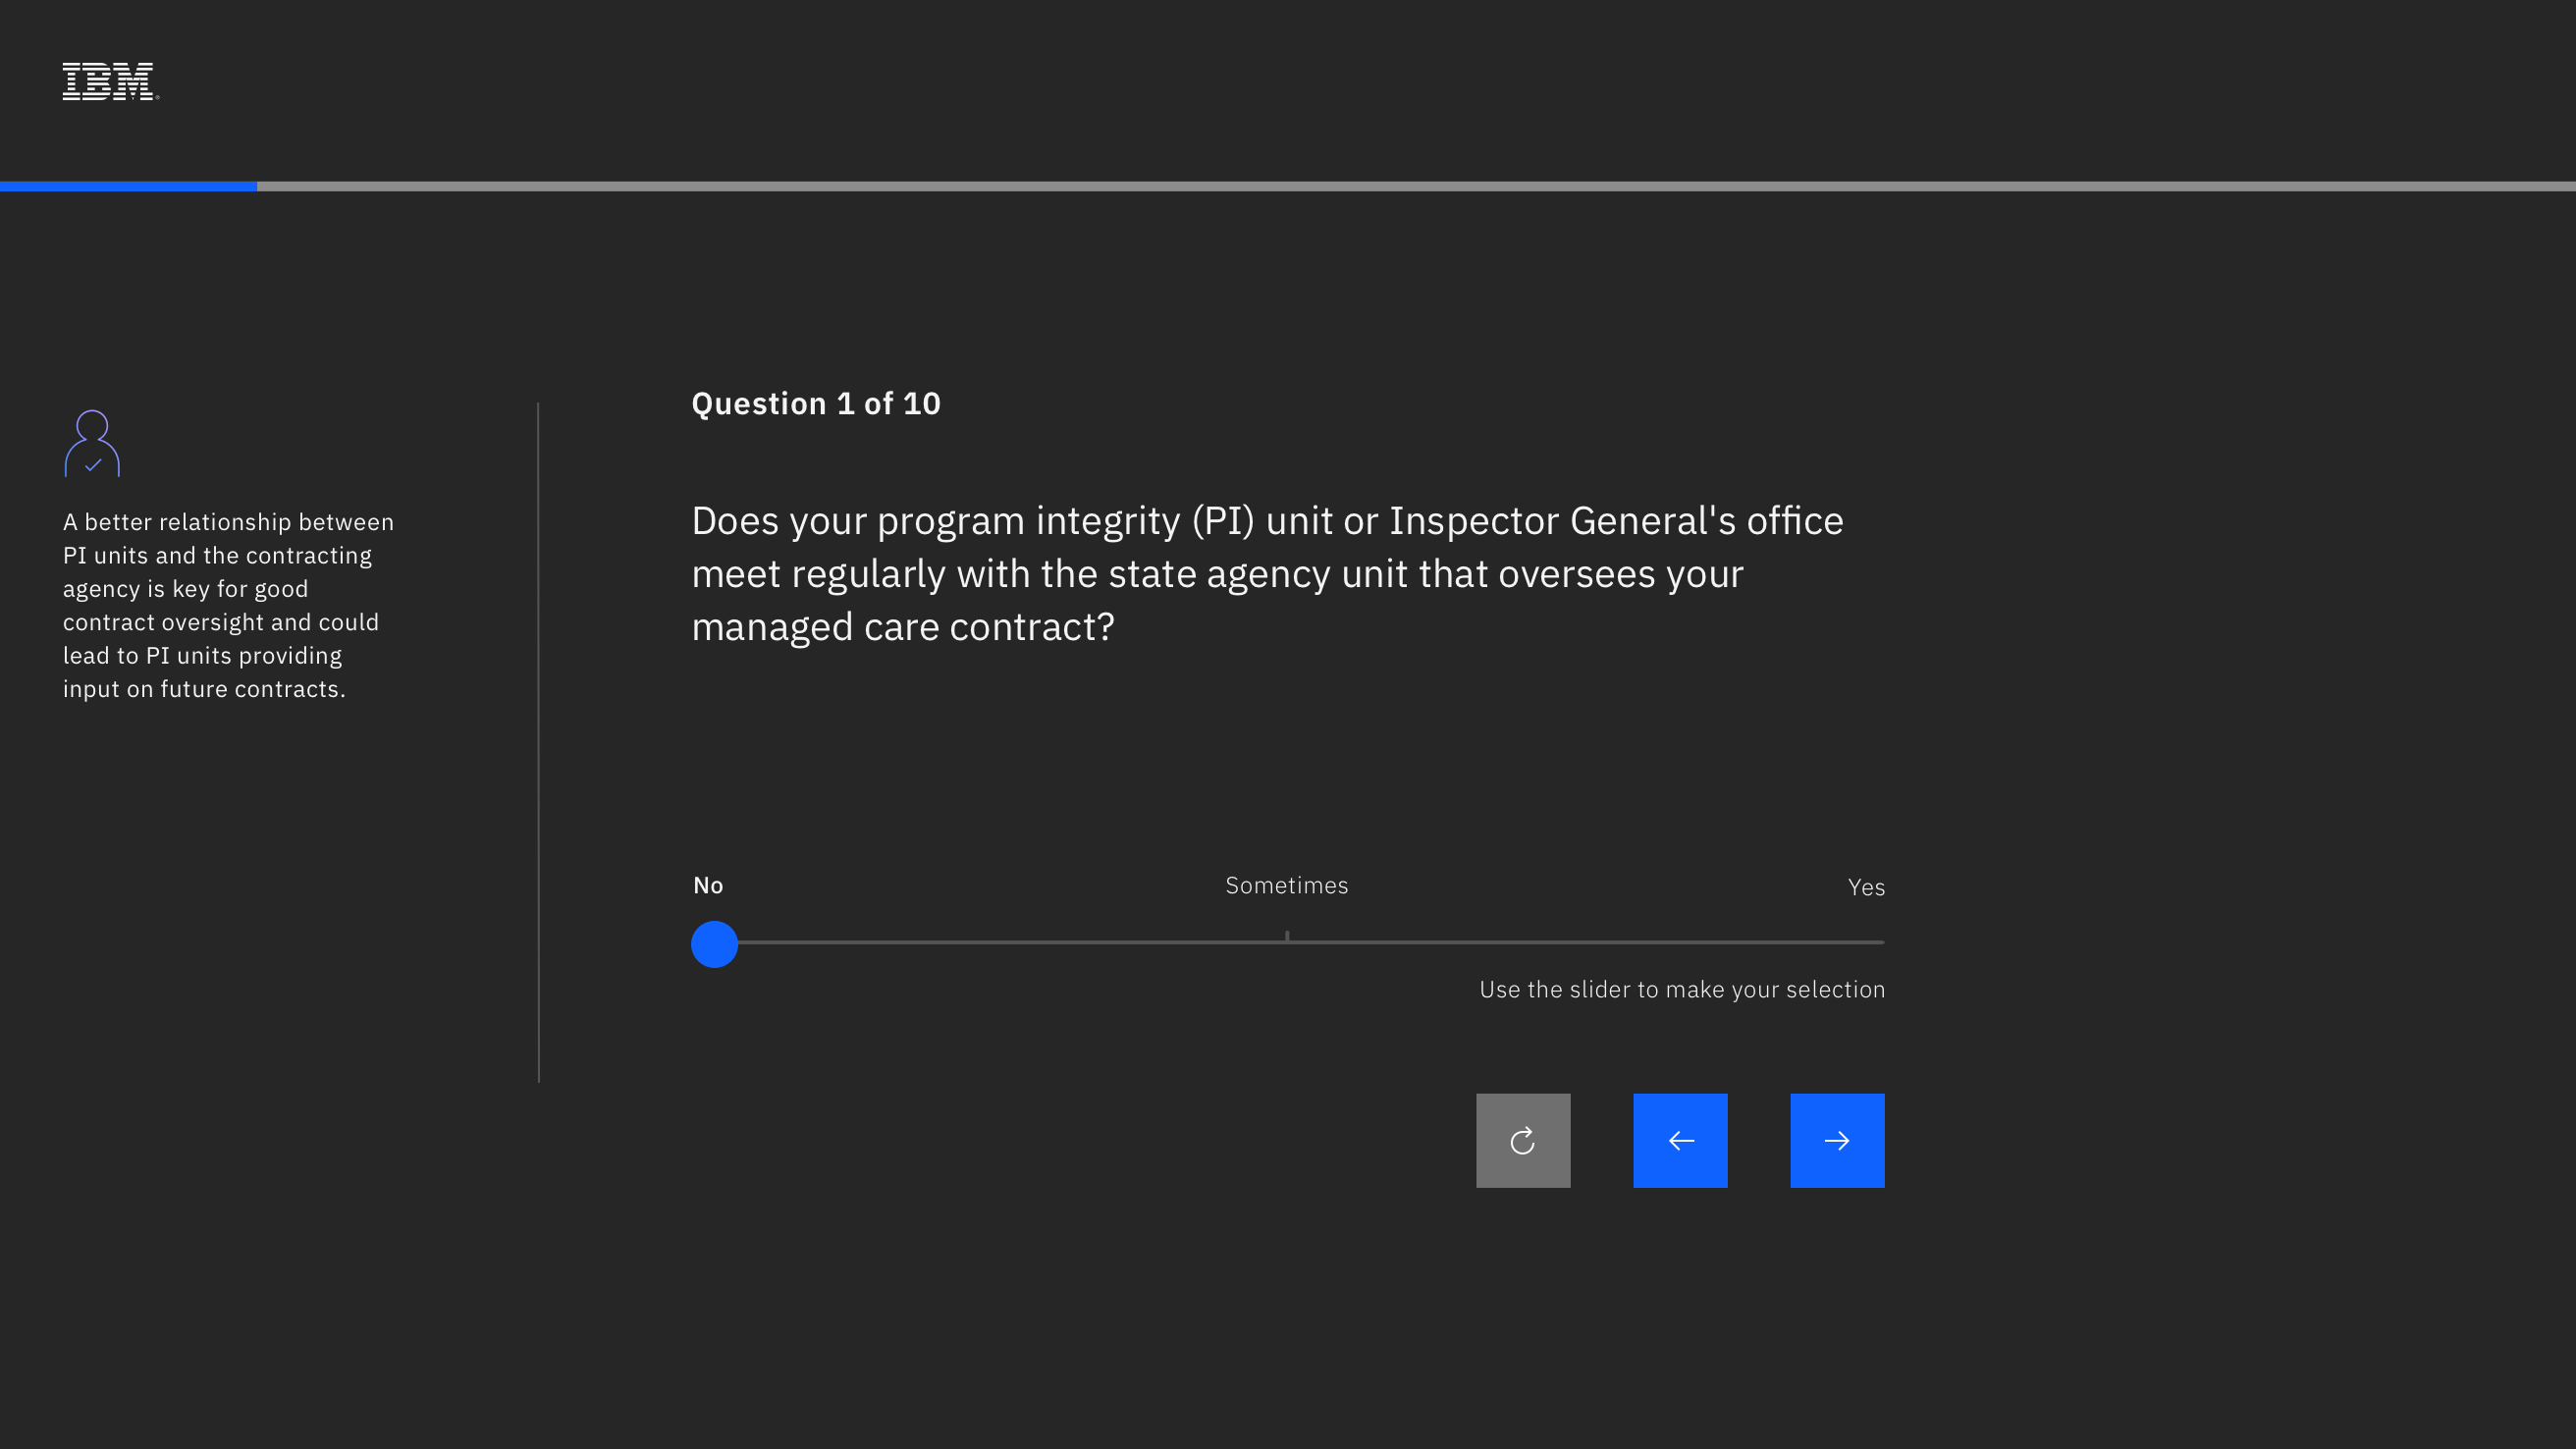
Design and develop the assessment and assist with updating content and logic. The tool/single-page application will be multiple-choice, leveraging sliders as a means of choosing the answer with up to (10) questions that assess the audience's current compliance readiness, and directs them to consultants that can help them understand and comply with government mandates. The assessment can be self-driven by an interested customer and/or facilitated as a sales enablement tool. The output will offer a tailored visual representation with suggestions and assets based on results to further engage and transact with compliance consultants.


UX
As part of my UX role, I mocked up wireframes to asset the project. The mockup helped with page inventory and content placement for the team to understand how the pages interact.
By analyzing each page and caring about the users who interact with the assessment, helped me build a product that is better suited to their needs and ultimately a better experience. As a UX designer, I must advocate for the users and ensure IBM's business goals align with the user goals in a visually intuitive way.

UI
As part of the UI design, bringing the project to life is crucial. At this step, I prototype the elements together with the IBM branding in place.